Influence Diagram
What is an Influence Diagram?
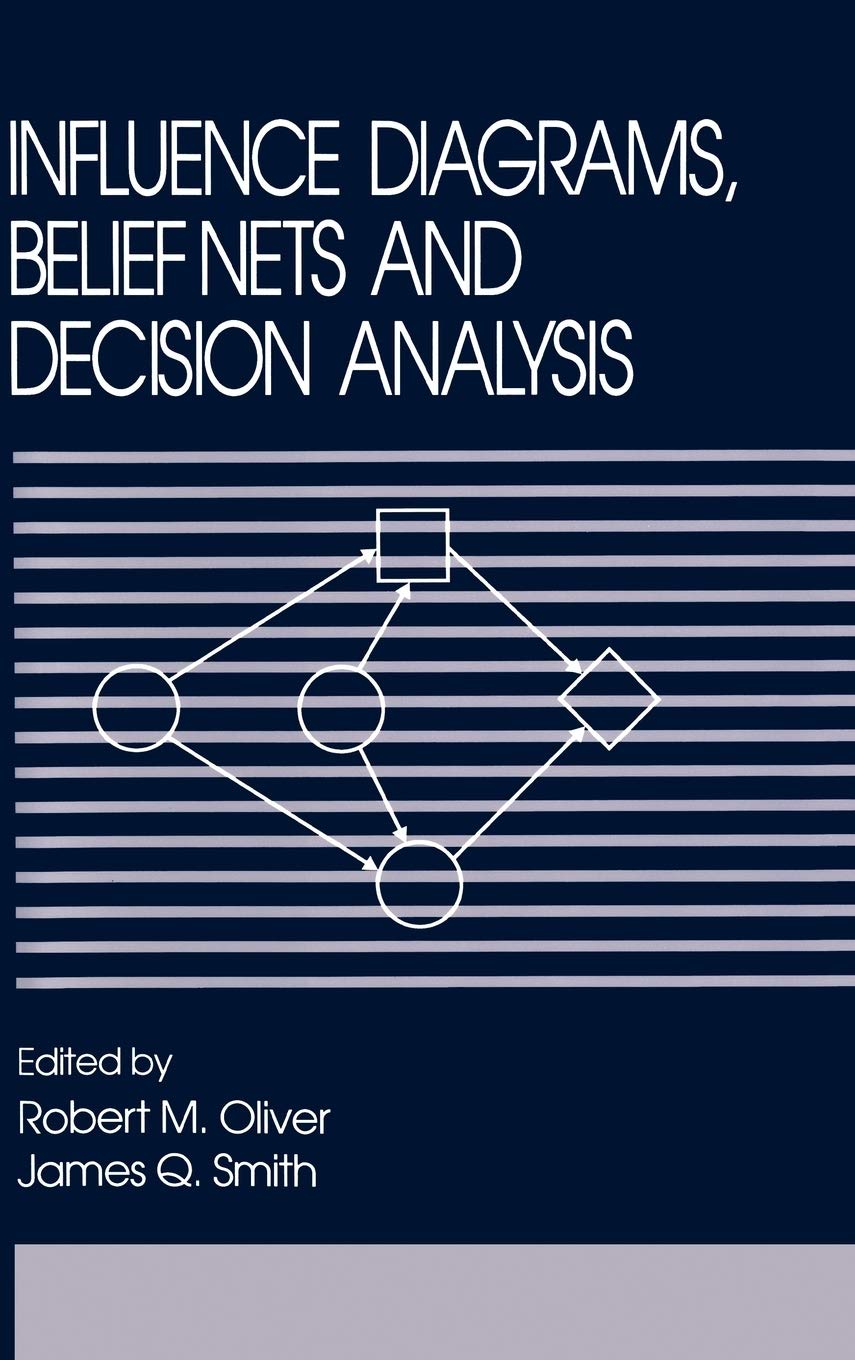
An influence diagram is a visual representation used in project management to show the relationships among decisions, uncertainties, and outcomes. It helps teams understand how different project elements affect one another, allowing for more informed decision-making. The diagram typically includes nodes and arrows: nodes represent decisions, variables, or objectives, while arrows show the direction of influence or dependency.
Project managers use this tool to analyze complex situations, clarify objectives, and identify the key factors that impact results. It simplifies decision analysis by highlighting the most important influences, making it easier to focus on what matters most. The influence diagram is handy when determining the best course of action during the project’s planning phase.
Key Points
- It is a simplified alternative to decision trees and is often more compact and easier to interpret.
- It typically contains three types of nodes: decision nodes (choices), uncertainty nodes (risks or unknowns), and value nodes (outcomes or objectives).
- Arrows between nodes show how one element influences another, helping identify cause-and-effect relationships.
- This diagram supports decision-making by making dependencies and uncertainties more visible.
- Project managers often use it in risk analysis, strategic planning, and resource allocation.
Related Terms
- The decision tree is a related tool that presents decision-making paths in a branching format. It is often used alongside an influence diagram.
- Insights from an influence diagram may inform a risk register, especially when mapping out potential project risks.
- The project charter may reference influence diagrams to justify key decisions during project initiation.
- Stakeholder analysis benefits from influence diagrams by identifying how stakeholder interests might impact project outcomes.
- An assumption log can include assumptions identified through the development of an influence diagram.
Influence Diagram: Example
Imagine a project team planning a product launch. The diagram includes a decision node for the launch date, an uncertainty node for market demand, and a value node for expected revenue. Arrows show that market demand influences the launch date and the revenue, helping the team analyze the best timing for maximum return.
Influence Diagram: Best Practices
- Keep the diagram simple and focused by including only the most critical decisions and uncertainties.
- Involve key stakeholders to ensure all critical factors are identified and accurately represented.
- Use clear labels and consistent symbols to improve readability and understanding.
- Review and update the diagram regularly as new information becomes available.
- Combine the diagram with other decision-making tools to strengthen analysis and planning.
Additional Resources
Preparing for a PMI certification?
- Exam Prep Courses: PMP®, CAPM®, and PMI-ACP®
- Exam Simulators: PMP®, CAPM®, PMI-ACP®, PMI-PBA®, PMI-RMP®, PMI-SP®, PgMP®, and PfMP®
- Professional Development Units (PDUs): 15, 30, and 60 PDU Bundles


