
The Mode, The Median, and The Mean – All About The 3 Main Measures of Central Tendency
January 13, 2023
Statistics plays a crucial role in various fields, from scientific research to business analytics. When analyzing data, one fundamental concept is determining the central tendency of a distribution. In this article, we will delve into the three primary measures of central tendency – the mode, median, and mean. By understanding these measures and their applications, you will gain valuable insights into how data is summarized and interpreted.
The Mode, The Median, and The Mean – All About The 3 Main Measures of Central Tendency
Some people might find the mention of statistics utterly boring, but Six Sigma practitioners that have completed their Lean Six Sigma Green Belt training are aware that Six Sigma projects would not be successful without them. Simply said, statistics is an essential component of data-driven projects that use the Six Sigma methodology.
When you reach the Green Belt level of Six Sigma, it’s necessary to comprehend several statistical techniques on a fundamental level. Green Belts and Black Belts in Six Sigma frequently make calculations using statistical programs like MINITAB. Nevertheless, it is really beneficial to comprehend the guiding ideas behind a measure, including the central tendency measures.
According to trustworthy free online Lean Six Sigma training courses, statistical techniques are employed during the “Measure” & “Analyze” steps of the DMAIC (Define, measure, analyze, improve, and control) process. Measures of central tendency are the most fundamental statistics any Six Sigma practitioner is going to examine. At the top of the list of things Six Sigma teams need to look at following data collection are the measures of central tendency.
Statistics And Its 2 Branches
First, let’s examine two statistical subfields. Descriptive statistics is referred to as branch no. 1, while inferential statistics is branch no. 2. These are the main two branches of statistics. A process, population, or sample’s characteristics like location (measurements of central tendency), shape (skewness & peaks), and/or spread (variation) are all described using descriptive statistics. As a result, central tendency measurements are a subset of descriptive statistics.
Based on samples of information collected from some population, inferential statistics draw conclusions and forecasts about that population using the data. These are often applied in the DMAIC process’ “Analyze” phase.
What are Measures of Central Tendency?
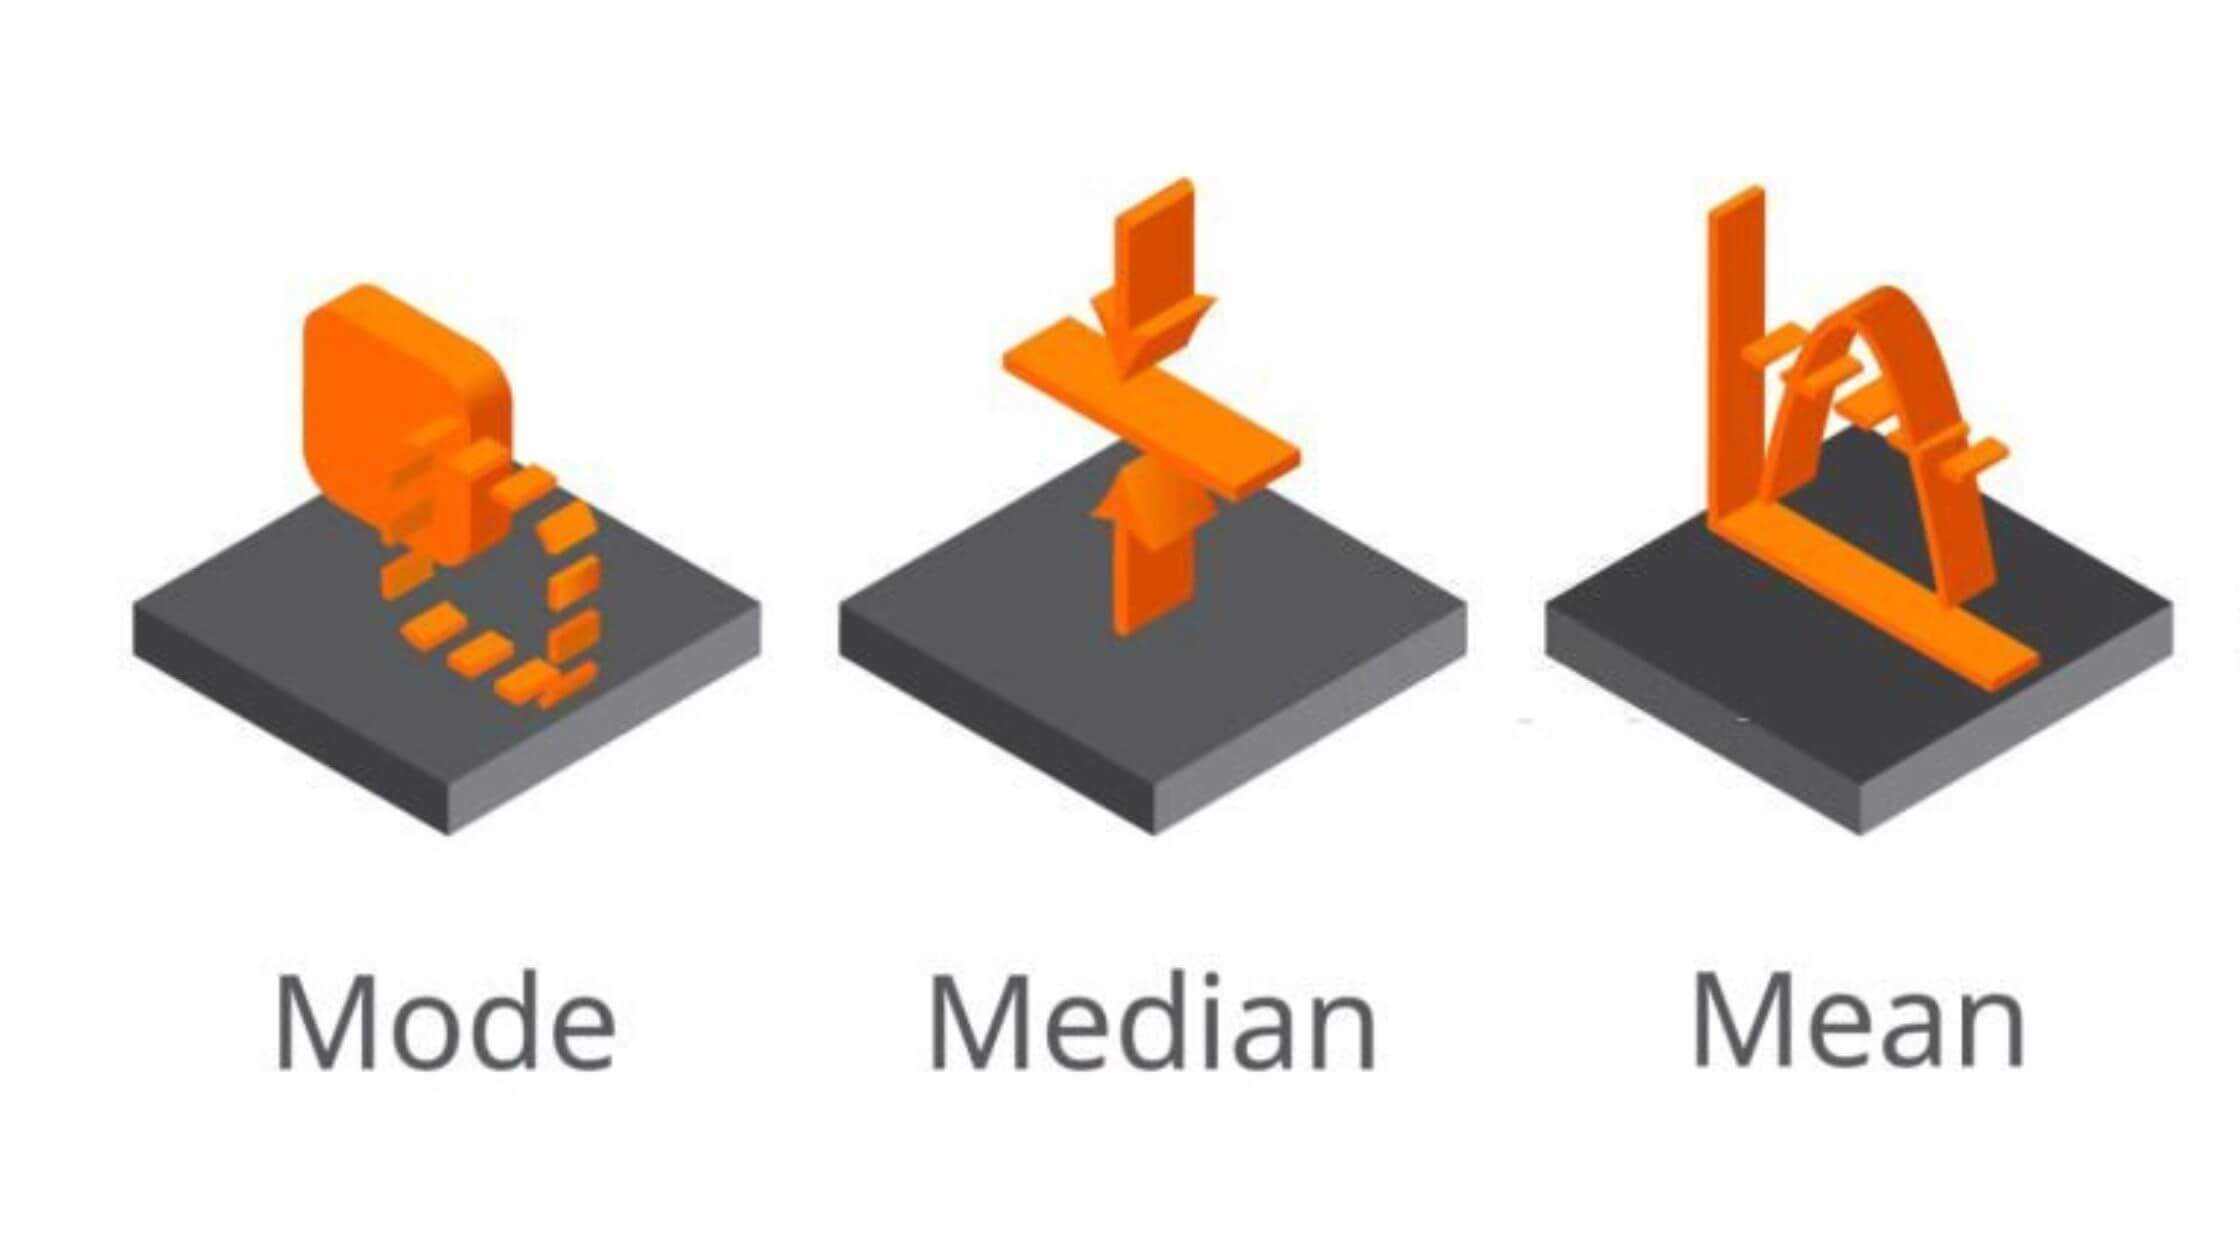
Measures of central tendency provide a summary of the center or typical value of a dataset. They aim to identify a single value that represents the distribution as a whole. The three main measures of central tendency are:
1. Mode
The mode represents the most frequently occurring value or values in a dataset. It is particularly useful when dealing with categorical or discrete data. For example, in a survey where respondents select their favorite color, the mode would represent the color chosen by the highest number of participants.
The figure in a population that appears most frequently is referred to as the mode. The most items are found in and surrounding it, and it’s a real value. Let’s see the following examples to understand it better.
Example 1:
1+2+3+4+5+5+6+7+8 = 5
In example 1, 5 is the value that appears most frequently. That means the mode for this collection of data is 5. In example 2, the collection of data had three instances of the 10 and 7 values, so, the mode is going to be between 10 and 7.
Example 2:
12,10,15,24,30 (No Mode)
7,10,15,12,7,14,24,10,7,20,10 (The Mode is 7 & 10)
A formula is always needed, otherwise nothing in statistics would function. You must have the formula you want to use for every statistical operation you want to solve. Naturally, all of the central tendency measures can be quite simple to compute using software programs like Microsoft Excel, but it is still beneficial to know the right way to do it manually.
2. Median
The median is the middle value in an ordered dataset when arranged in ascending or descending order. It is a robust measure that is not affected by extreme values or outliers. To calculate the median, arrange the data and select the value at the center. If the dataset has an even number of values, the median is the average of the two middle values.
How Do You Figure Out The Median?
The median’s formula is written as n + 1 / 2. The value located at the spot provided by this formula’s answer will be called the median. Let’s consider the following examples.
Example:
1+2+3+4+5+6+7+8=(8+1)/2=4.5
Example 2:
62+68+72+60+50+58+58+49+66+70 / 10 = 61.3
The formula has been used to keep count between the first and last number. It brings the answer to 4.5, but 4.5 is not the median. The median value is the one that stands in the 4.5th place. So, how would we determine the value that occupies the 4.5th spot, then? The calculation we need to do would be taking the fourth value, adding half of the fifth value, and then subtracting the fourth value.
We’ll be using the same waiting time situation we used before for example no. 2. The waiting time information was arranged in increasing order. We must count the amount of data and create the formula to get the median. The answer in this case is 5.5. The median value is the one that stands in 5.5th place. Consequently, 61 minutes will be the median.
3. Mean
The mean, often referred to as the average, is calculated by summing all values in the dataset and dividing by the total number of values. It is widely used and provides a measure of the central value by considering all data points. However, the mean is sensitive to extreme values and can be influenced by outliers.
How Do You Figure Out The Mean?
Let’s check out some examples in order to better understand every measure of central tendency. First, we have an example to find the mean.
Example 1:
(1+2+3+4+5+6+7+8)/8 = 36 / 8 = 4.5
The sum of the numbers from one to eight was divided by the total number of items (8). Therefore, 4.5 is the result. The mean or average is 4.5.
Example 2:
62+68+72+60+50+58+58+49+66+70 / 10 = 61.3
For example 2, we have a collection of data that will be analyzed to find the mean. Let’s say you want to calculate the average waiting time at a clinic, so you take down notes of how long every patient had to wait for their turn. To determine the average, the data for ten patients were gathered on a particular day. Minutes were used as the measuring unit for data collecting.
We added together the waiting time for ten different individuals, divided the total by the number of items on the equation, and got the mean waiting time for all patients. The answer here is 61.3 minutes. There is a 61.3-minute timeframe here. That is how the most popular measure of central tendency works.
Applications and Interpretations
Each measure of central tendency has its own applications and interpretations:
1. Mode
The mode helps identify the most frequent or popular category in a dataset. It is commonly used in marketing research, voting analysis, and quality control. For example, a clothing retailer can use the mode to determine the most commonly purchased size of a particular product, guiding inventory management decisions.
2. Median
The median is useful when dealing with skewed distributions or when extreme values are present. It is often used in income distribution analysis, housing price studies, and exam score evaluations. For instance, the median income provides a more accurate representation of the typical income level in a region compared to the mean, which can be influenced by a few high-income individuals.
3. Mean
The mean is widely utilized in various statistical analyses, such as calculating the average test score, estimating population parameters, and assessing performance metrics. It provides a balanced representation when data follows a symmetrical distribution and outliers are not a concern. The mean is also used in inferential statistics to estimate population parameters based on sample data.
Sign-up for a 7-day free trial! Try the first two modules of Brain Sensei’s story-based PMP and CAPM Exam Prep courses and a mini practice exam and see how it all works
Conclusion
Measures of central tendency, including the mode, median, and mean, serve as fundamental tools for summarizing and interpreting data. Each measure has its strengths and applications, enabling analysts and researchers to gain valuable insights from their datasets. By understanding the concepts and applications of these measures, you can confidently analyze data and draw meaningful conclusions in various fields.
Have you led projects and are looking to earn a project management certification? You might be interested in learning about how lucrative this can be. Check out these articles.
13 PMP Benefits Once You Get The PMP Certification
No experience leading projects but still want to get into project management? No problem! Check out these articles.
CAPM Certification Eligibility
What is a Certified Project Manager; How do I get PM Certifications