
Information Radiator
March 1, 2025
« Back to Glossary Index
What is an Information Radiator?
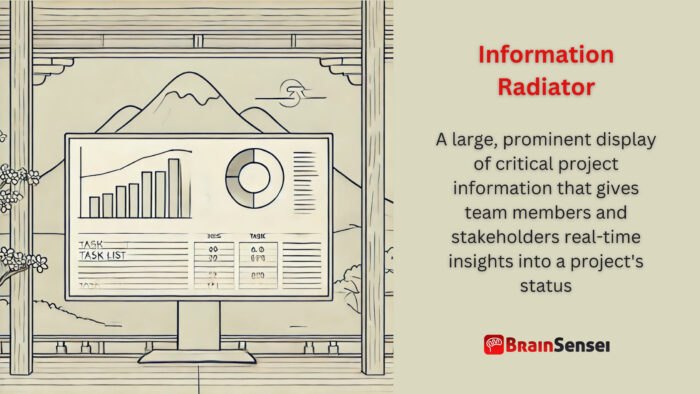
An information radiator is a large, prominent display of critical project information that promotes transparency and fosters a sense of connection among team members and stakeholders. It encourages collaboration, making everyone feel involved and valued, and supports quick decision-making, ensuring everyone’s voice is heard. Information radiators can take various forms, such as physical boards, digital dashboards, or wall charts, catering to different preferences.
Key Takeaways
- Provides real-time visibility into project status and performance
- Enhances team collaboration through transparent communication
- Supports faster, data-driven decision-making
- It can be physical (e.g., Kanban boards) or digital (e.g., dashboards)
- Crucial for Agile, Scrum, and Lean project management frameworks
Understanding the Information Radiator
How It Works
An information radiator displays essential project metrics, updates, and risks in an accessible format. Teams use it to track progress, identify blockers, and prioritize tasks. Standard components include task lists, burndown charts, and issue logs.
Notes
- Place it in a prominent location for easy visibility
- Update the content regularly to reflect the current project status
- Design should be intuitive, with clear charts and minimal clutter
- Digital radiators may integrate with project management tools for real-time updates
Related Terms
- Kanban Board: A visual tool that displays work items across workflow stages
- Scrum Board: A task board used in Scrum projects to track sprints
- Burndown Chart: A graph representing work completed versus remaining work
- Project Dashboard: A digital interface showing key project metrics
- Andon Board: A visual control device in Lean manufacturing for real-time issue tracking
Examples of Information Radiators in Different Industries
Manufacturing
In a car manufacturing plant, an Andon board is the information radiator, highlighting production targets, completed units, and downtime events. The board displays the issue when a machine malfunctions, enabling swift intervention. The Andon system shows the status of various production lines and uses colour-coded indicators to convey the severity of issues. Managers and workers can quickly identify problems and respond proactively, minimizing production downtime. Regularly updated performance charts also help analyze efficiency and plan maintenance schedules. Safety metrics and employee productivity figures also reinforce the importance of safe and efficient work practices.
IT & Software Development
A software development team employs a digital Scrum board to track sprint progress. User stories move from ‘To-Do’ to ‘Done,’ while a burndown chart displays the sprint’s velocity, helping the team identify scope creep. Digital tools like Jira or Trello integrate real-time updates, ensuring all team members, whether co-located or remote, have the same information. Sprint goals, team velocity metrics, and deployment schedules are visible to everyone. Code quality dashboards might display the number of bugs reported and fixed, ensuring technical debt remains controlled. The team maintains focus and alignment by visualizing daily stand-up updates and retrospective insights.
Healthcare & Pharmaceuticals
A hospital’s operations center uses a dashboard to monitor bed occupancy, patient admissions, and staffing levels. Real-time updates allow staff to reallocate resources and respond to emergencies efficiently. In addition to patient flow data, information radiators display hygiene audit results, equipment availability, and lab turnaround times. For example, during the COVID-19 pandemic, hospitals used dashboards to track infection rates, PPE stock levels, and vaccination statuses. Such transparency improved communication between departments and enabled more informed decision-making for patient care and resource allocation.
Retail & Wholesale
Retail stores use dashboards to monitor sales performance, inventory levels, and customer feedback. For example, a clothing retailer might track best-selling items, stock replenishment schedules, and seasonal sales trends. Staff members access the display to check daily targets and performance comparisons across store locations. Information radiators in distribution centers help optimize logistics by displaying shipment statuses, delivery timelines, and warehouse capacities.
Energy & Utilities
Power plants and energy providers use control room dashboards to track energy production, equipment health, and regulatory compliance metrics. Operators monitor real-time data on electricity generation, grid stability, and maintenance activities. For instance, wind farm operators use dashboards to view turbine performance, wind speed data, and system alerts, ensuring proactive maintenance and maximum energy efficiency.
Use Cases of Information Radiators Across Regions
United States (IT Industry)
A Silicon Valley tech company adopts an interactive dashboard for its Agile teams. This radiator integrates with Jira and Trello, providing instant access to task statuses and performance metrics across distributed teams. The company has multiple teams working on different components of the same product. The information radiator ensures everyone is on the same page, even across different time zones. Teams can see task assignments, work progress, impediments, and goals. This transparency helps identify bottlenecks quickly and aligns everyone’s efforts toward common objectives. Additionally, executives use high-level dashboards to track KPIs and assess project performance across various departments.
The company also employs information radiators to track customer feedback and production incidents. By visualizing real-time data, teams can proactively address potential issues before they affect users. The dashboard integrates with incident management tools, allowing immediate incident response and resolution.
Germany (Automotive Industry)
A German automotive company installs digital Andon boards across its factories. These boards display production KPIs and machine performance data, enhancing predictive maintenance. The Andon boards show the status of assembly lines, equipment efficiency, and defect rates. If an issue arises, such as a machine overheating, the system triggers an alert, and the display indicates the affected machine’s location. Maintenance teams respond more quickly, reducing downtime.
In addition to monitoring production lines, the company uses dashboards to track supply chain data. These dashboards display supplier performance metrics, delivery schedules, and inventory levels. Managers identify and mitigate potential disruptions by visualizing the supply chain, ensuring just-in-time delivery.
India (Software Development)
An Indian software firm uses large digital walls to display code integration status, test results, and deployment schedules, ensuring seamless collaboration across development and operations teams. The walls show pipeline stages for various projects, highlighting successful builds, failed tests, and deployment timelines. Development teams can quickly identify and fix build errors while product managers track feature delivery progress.
The information radiator also supports cross-team collaboration by displaying dependency maps. When a team introduces a change, others can see its potential impact and plan their work accordingly. Regular updates keep everyone informed about infrastructure changes, product releases, and system performance.
Best Practices for Using Information Radiators
To implement information radiators effectively, organizations must adopt practices that ensure accuracy, relevance, and accessibility. The following strategies help maximize the benefits of these tools:
Select Relevant KPI Metrics
Identify and display only the most critical data. Too much information can overwhelm users, diluting the impact of essential metrics.
Ensure Regular KPI Updates
An information radiator is only as useful as the data it presents. Establish a routine to update information at consistent intervals, preferably in real time.
Prioritize Clarity and Simplicity
Use clear labels, intuitive layouts, and easily interpretable graphics like charts and graphs. Avoid jargon and clutter.
Position Strategically
Place physical displays in high-traffic areas where teams naturally gather. For virtual dashboards, ensure they are easily accessible through commonly used tools.
Integrate with Existing Tools
Connect the radiator with project management platforms, such as Jira, Asana, or Trello. Integration reduces manual updates and ensures data consistency.
Train Team Members
Educate staff on how to interpret the displayed information. Training ensures that insights are correctly understood and applied.
Encourage Team Engagement
Foster a culture where team members contribute to and use the radiator. Solicit feedback to refine its content and presentation continually.
Use Color Coding Wisely
Apply color schemes to convey different statuses, such as green for ‘on track,’ yellow for ‘at risk,’ and red for ‘critical.’ Color enhances the radiator’s readability at a glance.
Conduct Regular Reviews
Schedule periodic evaluations to assess the radiator’s effectiveness. Adjust the displayed metrics based on project phases or organizational changes.
Ensure Data Accuracy
Inaccurate information can erode trust. Implement data validation practices and designate individuals responsible for content verification.
KPI and Information Radiator: Common Mistakes and Issues
While information radiators provide significant benefits, they are prone to several common mistakes and issues. Understanding these pitfalls helps organizations implement these tools more effectively:
Outdated Information
An outdated information radiator can mislead team members, resulting in poor decisions. For example, a project dashboard showing completed tasks that are still in progress may cause confusion during sprint planning. Teams must establish processes to update displays regularly.
Information Overload
Displaying too much information overwhelms users. Radiators should prioritize essential data like task status, milestones, and blockers. Cluttered boards reduce the tool’s effectiveness by obscuring critical insights.
Poor Placement
Physical information radiators placed in low-traffic areas will fail to achieve their purpose. Teams must position displays where stakeholders naturally gather, such as break rooms or team collaboration spaces.
Lack of Context
Data alone doesn’t tell a complete story. Radiators should provide context to help viewers interpret information accurately. For instance, adding annotations or color codes to performance charts clarifies their implications.
Insufficient Team Engagement
Information radiators require active participation from team members. If teams don’t use or update the radiator regularly, its relevance diminishes. Regular training and engagement initiatives can address this issue.
Technical Failures
Digital radiators depend on technology, which may experience glitches or connectivity issues. Teams should implement backup plans and conduct routine maintenance to prevent disruptions.
Security Concerns
Publicly visible information radiators may expose sensitive data. Organizations should balance transparency with confidentiality by restricting access to sensitive project metrics.
Frequently Asked Questions (FAQs)
What should the project team include on an information radiator?
Include task statuses, performance metrics, upcoming milestones, and identified risks. Choose data that supports timely and effective decision-making.
Are information radiators only for Agile teams?
While common in Agile environments, information radiators benefit any project team needing real-time insights.
What is the difference between an information radiator and a project dashboard?
An information radiator is typically more public and visual, while a dashboard is often accessed via a device and may be more detailed.
How often should we update an information radiator?
Update it as frequently as project dynamics change, ideally in real time.
Can information radiators be a virtual KPI?
Yes, many teams use digital tools like Jira, Trello, or Asana to create virtual radiators accessible to remote team members.
Additional Resources
Preparing for a PMI certification?
- Exam Prep Courses: PMP®, CAPM®, and PMI-ACP®
- Exam Simulators: PMP®, CAPM®, PMI-ACP®, PMI-PBA®, PMI-RMP®, PMI-SP®, PgMP®, and PfMP®
- Professional Development Units (PDUs): 15, 30, and 60 PDU Bundles