Dashboard
May 23, 2025
« Back to Glossary Index
What is a Dashboard?
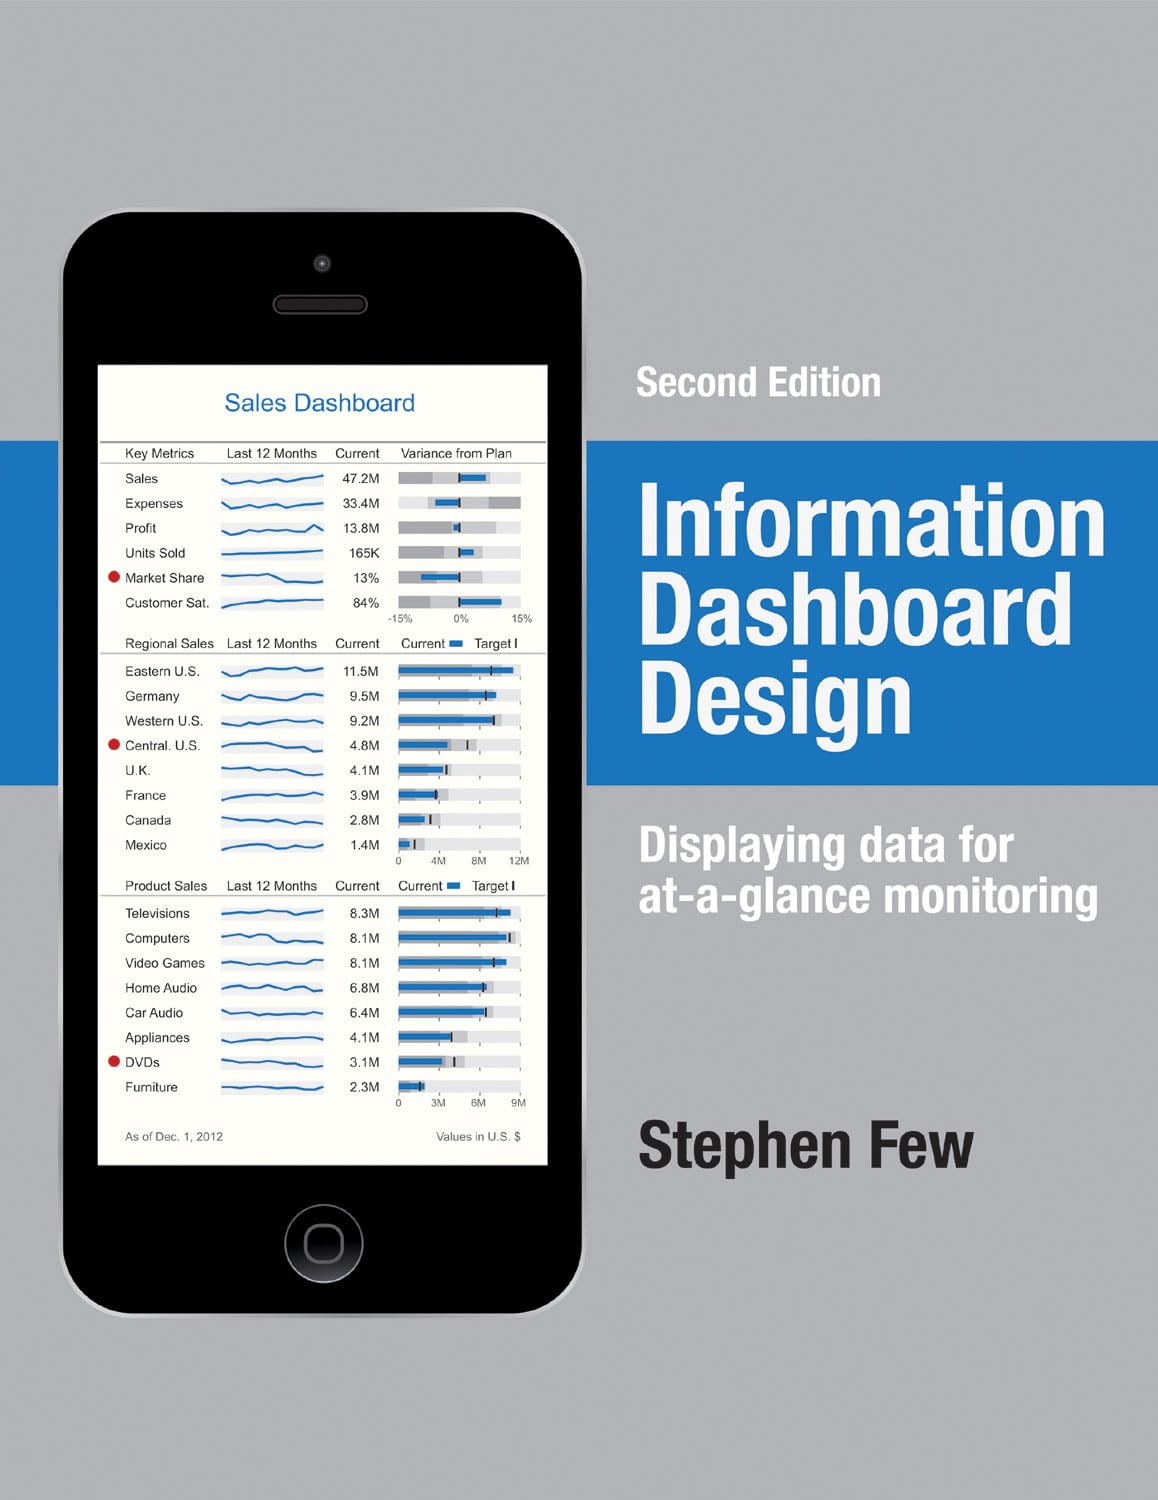
A dashboard is a visual display of key project information, such as progress, performance metrics, and upcoming tasks. It gathers data from multiple sources and presents it in a simple, easy-to-read layout. Project managers and team members use dashboards to monitor real-time updates, track deadlines, and assess overall status. This tool helps ensure transparency and supports quick, informed decision-making throughout a project’s lifecycle.
Dashboards can be digital or cloud-based and are often part of project management software. They may include charts, graphs, timelines, and colour-coded indicators highlighting risks or issues. They reduce the need for lengthy status reports or manual tracking by centralizing essential data in one location.
Key Points
- It presents real-time data about a project’s status and performance.
- It helps stakeholders quickly identify risks, delays, and progress trends.
- It includes visual tools like bar charts, pie charts, and timelines.
- It supports faster, more accurate decisions by displaying live updates.
- It improves transparency by making information accessible to all team members.
Related Terms
- A project status report often feeds data into a dashboard to show progress against the project plan.
- Teams can embed a Gantt chart in a dashboard to visualize the timeline of project tasks.
- A key performance indicator (KPI) is usually displayed on a dashboard to measure success against set goals.
- It enhances project tracking by compiling task completion data and milestones.
- Project management software commonly includes dashboards to help teams coordinate their efforts.
Dashboard: Example
A project manager overseeing a website redesign uses a dashboard to monitor progress. It displays current tasks, overdue items, resource allocation, and a timeline. A red indicator shows that the content writing phase is behind schedule. The team reviews the dashboard in a morning meeting and adjusts assignments to stay on track. Stakeholders also check the dashboard to view updated progress without needing weekly reports.
Dashboard: Best Practices
- Keep the layout clean and simple to avoid confusion.
- Show only the most relevant data to prevent information overload.
- Use colour coding and visual aids to highlight essential updates or issues.
- Update data sources regularly to ensure accuracy.
- Make it accessible to all stakeholders for increased transparency.
Additional Resources
Preparing for a PMI certification?
- Exam Prep Courses: PMP®, CAPM®, and PMI-ACP®
- Exam Simulators: PMP®, CAPM®, PMI-ACP®, PMI-PBA®, PMI-RMP®, PMI-SP®, PgMP®, and PfMP®
- Professional Development Units (PDUs): 15, 30, and 60 PDU Bundles