
Control Limits
March 7, 2025
« Back to Glossary Index
What Are Control Limits?
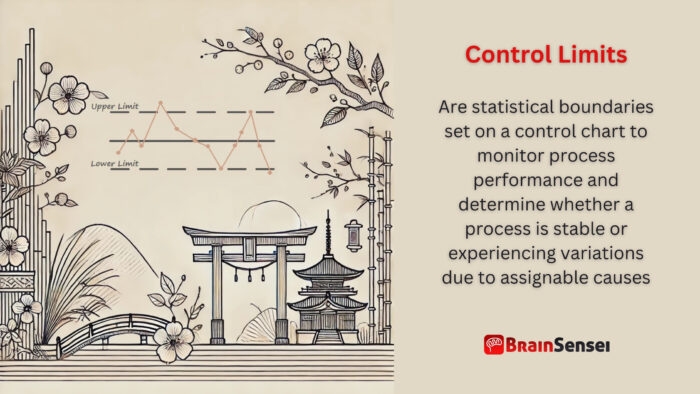
Control limits are statistical boundaries set on a control chart to monitor process performance and determine whether a process is stable or experiencing variations due to assignable causes. These limits, typically represented as an upper control limit (UCL) and a lower control limit (LCL), help organizations maintain quality and consistency in project management and production processes.
Key Takeaways
- Control limits differentiate between normal process variations and out-of-control conditions.
- Project managers (or analysts) calculate control limits using statistical methods, typically setting them at three standard deviations from the project metric’s mean.
- Used in quality control to maintain consistent and predictable project outcomes.
- Help project managers identify when corrective actions are necessary.
- Ensure that project deliverables meet predefined quality standards.
Understanding Control Limits
How They Work
Control limits are used in statistical process control (SPC) to assess whether a process operates within expected parameters. By plotting sample data on a control chart, project managers can identify deviations and determine whether they stem from common causes (natural variations) or special causes (unexpected disruptions).
For example, in manufacturing, these limits help ensure products stay within acceptable quality levels. If data points exceed the UCL or LCL, it signals a need for investigation and corrective measures.
Notes
- Not Specification Limits: Control limits differ from specification limits, which define customer expectations.
- Calculated from Historical Data: The project team bases them on actual project performance rather than arbitrary thresholds.
- Dynamic in Nature: This can be adjusted as process improvements occur.
- Used in Continuous Improvement: Helps organizations refine workflows and reduce defects over time.
Related Terms
- Upper Control Limit (UCL): The highest boundary within which a process is considered stable.
- Lower Control Limit (LCL): The lowest boundary within which a process is considered stable.
- Process Capability: Measures how well a process meets design specifications.
- Six Sigma: A methodology that reduces process variation and improves quality control.
- Statistical Process Control (SPC): The use of statistical techniques to monitor and control a process.
- Assignable Cause Variation: A specific, identifiable factor contributing to process inconsistencies or deviations.
Examples of Control Limits in Use
Manufacturing Industry: Reducing Defective Products
A car manufacturer uses control charts to monitor the thickness of vehicle paint coatings. If measurements exceed control limits, the company investigates potential causes, such as spray nozzle issues or inconsistent material quality, ensuring the final product meets quality standards. Using statistical process control, the manufacturer can reduce waste, improve product consistency, and ensure regulatory compliance.
Moreover, the company tracks the efficiency of robotic arms when applying paint. If the paint thickness starts trending toward the limits, maintenance teams perform calibrations to prevent defects before they occur. This proactive approach reduces rework, lowers production costs, and enhances customer satisfaction.
Healthcare Industry: Monitoring Patient Vital Signs
Hospitals use control limits to monitor patient heart rates after surgery. Doctors take immediate corrective action to prevent complications if a patient’s heart rate exceeds the limits. This system allows for the early detection of anomalies, enabling healthcare providers to intervene before a critical situation arises.
Additionally, these limits are used in intensive care units to track oxygen saturation, blood pressure, and other vital signs. Advanced monitoring systems automatically alert medical personnel when values approach critical thresholds. These measures ensure patient safety and improve treatment outcomes by allowing for real-time adjustments in care.
IT Industry: Ensuring Server Uptime
An IT company tracks server response times and sets control limits to detect performance issues. The team investigates server loads or network disruptions if response times exceed limits to maintain optimal performance. This approach ensures smooth digital experiences for users and prevents downtime-related revenue losses.
Furthermore, the IT team uses control charts to monitor CPU usage and memory allocation. Engineers implement load-balancing solutions or optimize database queries if server load consistently trends toward the UCL. These preventive measures ensure the system remains reliable and scalable under increasing workloads.
Construction Industry: Ensuring Structural Integrity
Construction companies use control limits to monitor concrete strength and curing times. Engineers ensure the material meets structural requirements by testing samples throughout the curing process. They adjust the mixture or curing conditions if variations exceed limits to maintain safety standards.
For example, a bridge construction project might involve testing concrete samples daily. If compressive strength values show unexpected deviations, engineers investigate factors such as humidity, temperature, or material inconsistencies. This vigilance helps prevent structural failures and costly project delays.
Retail Industry: Optimizing Inventory Levels
Retailers apply control limits to track inventory turnover rates. If sales trends deviate from expected patterns, supply chain managers adjust procurement strategies to avoid overstocking or stockouts. This balance is crucial for maintaining profitability and customer satisfaction.
For instance, a fashion retailer might notice a clothing item selling faster than projected. By identifying trends through statistical analysis, managers can reorder stock before it runs out, preventing lost sales opportunities. Conversely, if sales drop unexpectedly, they may launch promotions or adjust pricing strategies to optimize inventory flow.
Use Cases of Control Limits
United States (Quality Control in Pharmaceutical Production)
A pharmaceutical company in the U.S. implements control limits to ensure medication potency remains consistent. By leveraging statistical process control techniques, they detect trends that could lead to quality issues and adjust raw materials or production methods as needed. This system ensures compliance with FDA regulations and maintains consumer safety.
Furthermore, the company applies predictive analytics to track deviations over time. Understanding fluctuations in active ingredient concentrations enhances manufacturing consistency and reduces waste.
Germany (Airline Maintenance Monitoring)
An airline in Germany applies control limits to track aircraft maintenance parameters. If an engine’s temperature exceeds these limits, technicians immediately check the engine to prevent potential failures. This monitoring system enhances safety, minimizes unexpected breakdowns, and reduces maintenance costs by identifying issues before they escalate.
Moreover, the airline uses trend analysis to optimize maintenance schedules. Engineers predict component wear rates by tracking historical performance data and schedule preventative maintenance to avoid operational disruptions.
Saudi Arabia (Oil Refinery Safety)
A petroleum refinery in Saudi Arabia uses control charts to monitor equipment pressure levels. Any readings outside control limits trigger automated shutdowns to prevent hazardous incidents. This system protects infrastructure and safeguards employees and the environment.
Additionally, the refinery implements advanced process control systems to adjust pressure levels dynamically. Integrating AI-based monitoring solutions minimizes fluctuations and enhances operational efficiency, ultimately reducing downtime and increasing productivity.
Best Practices for Using Control Limits
Effectively utilizing control limits ensures process stability and quality control in various industries. Below are best practices to maximize their effectiveness:
Establishing Accurate Baselines
Before setting control limits, organizations must analyze historical data to determine natural process variations. Reliable baselines improve accuracy and prevent unnecessary corrective actions due to normal fluctuations.
Using Data-Driven Decision Making
The team must base control limits on statistically valid calculations rather than arbitrary values. Relying on actual process data ensures meaningful insights and reduces errors.
Differentiating Between Common and Special Cause Variations
It is critical to understand the difference between normal variations and anomalies. Variations with common causes stem from inherent process fluctuations, while variations with unique causes require investigation and corrective actions.
Regular Monitoring and Review
The team must continuously monitor process performance to ensure control limits remain relevant. As operations evolve to accommodate improvements or new process conditions, adjustments may be necessary.
Training Teams on Statistical Process Control (SPC)
Employees should be well-versed in interpreting control charts and understanding control limits. Proper training enhances responsiveness to deviations and ensures efficient corrective measures.
Preventing Overreaction to Minor Deviations
Not all variations warrant corrective action. Reacting to every fluctuation can introduce unnecessary disruptions. Organizations should focus on trends rather than isolated points outside control limits.
Using Advanced Analytics and Automation
Modern industries leverage AI and machine learning to enhance control limit monitoring. Automated alerts, predictive analysis, and trend detection improve response times and accuracy.
Ensuring Cross-Functional Collaboration
Quality control teams, production managers, and engineers should collaborate to analyze deviations effectively. Cross-functional insights lead to well-informed process improvements.
Integrating Control Limits with Continuous Improvement Programs
Organizations practicing Lean Six Sigma or other quality methodologies should integrate control limits into their improvement strategies. Statistical monitoring helps identify waste, inefficiencies, and potential optimizations.
Maintaining Compliance with Industry Standards
Many industries have regulatory requirements for process stability. Ensuring control limits align with standards such as ISO 9001, FDA guidelines, or other industry-specific regulations.
Control Limits: Common Mistakes and Issues
Many organizations misinterpret control limits, leading to unnecessary interventions or overlooked quality problems. One common mistake is confusing control and specification limits, resulting in incorrect process adjustments. Specification limits define customer expectations, while control limits reflect process stability, so conflating the two can lead to overcorrection or underreaction.
Another issue arises when companies react to every fluctuation instead of focusing on long-term process stability. If managers make changes based on a single data point rather than examining trends, they risk introducing variability that disrupts process control. Proper statistical analysis should focus on patterns over time rather than isolated outliers.
Failure to distinguish between common cause and unique cause variations can lead to inefficient operations. Teams should manage common cause variations, which occur naturally within a process, using continuous improvement efforts. Unique cause variations, on the other hand, indicate significant deviations that require immediate intervention. Misidentifying these variations can lead to unnecessary process adjustments or overlooked quality concerns.
Another significant problem is a lack of employee training. Control limits and statistical process control techniques require specialized knowledge. Employees may misinterpret control charts without proper training, leading to inappropriate responses. Organizations should invest in training programs to ensure staff can effectively utilize control charts and make data-driven decisions.
Inadequate data collection methods can also compromise the effectiveness of control limits. If data sampling is inconsistent or unreliable, control charts may not accurately represent process performance. Ensuring accurate and consistent data collection methods is critical to maintaining valid limits and achieving process stability.
Lastly, failing to review and adjust control limits periodically can render them obsolete. Teams should recalibrate these limits as processes improve, and technologies evolve to reflect operating conditions. Organizations that neglect this step risk using outdated limits that no longer provide meaningful insights into process performance.
Addressing these common mistakes can help organizations optimize their use of control limits, enhance process stability, and improve overall efficiency.
Control Limits: Frequently Asked Questions (FAQs)
How are control limits calculated?
Project managers calculate control limits using statistical formulas based on standard deviation and project data. They typically set UCL and LCL at three standard deviations from the mean.
What is the difference between control limits and specification limits?
Control limits indicate process stability, while specification limits define acceptable product criteria based on customer requirements.
Can control limits change over time?
Yes, they can change over time, so they should be reviewed periodically and adjusted if process performance improves or changes significantly.
What happens if a data point falls outside control limits?
It signals a potential issue requiring investigation to determine if corrective action is needed.
Are control limits used in all industries?
Yes. Industries such as manufacturing, healthcare, IT, and finance use control limits to maintain quality and efficiency.
Additional Resources
- Project Quality Management. Techniques, Key Concepts, and More
- Project Quality Management, Third Edition: Why, What and How
Preparing for a PMI certification?
- Exam Prep Courses: PMP®, CAPM®, and PMI-ACP®
- Exam Simulators: PMP®, CAPM®, PMI-ACP®, PMI-PBA®, PMI-RMP®, PMI-SP®, PgMP®, and PfMP®
- Professional Development Units (PDUs): 15, 30, and 60 PDU Bundles