Burn Chart
September 8, 2025
« Back to Glossary Index
What is a Burn Chart?
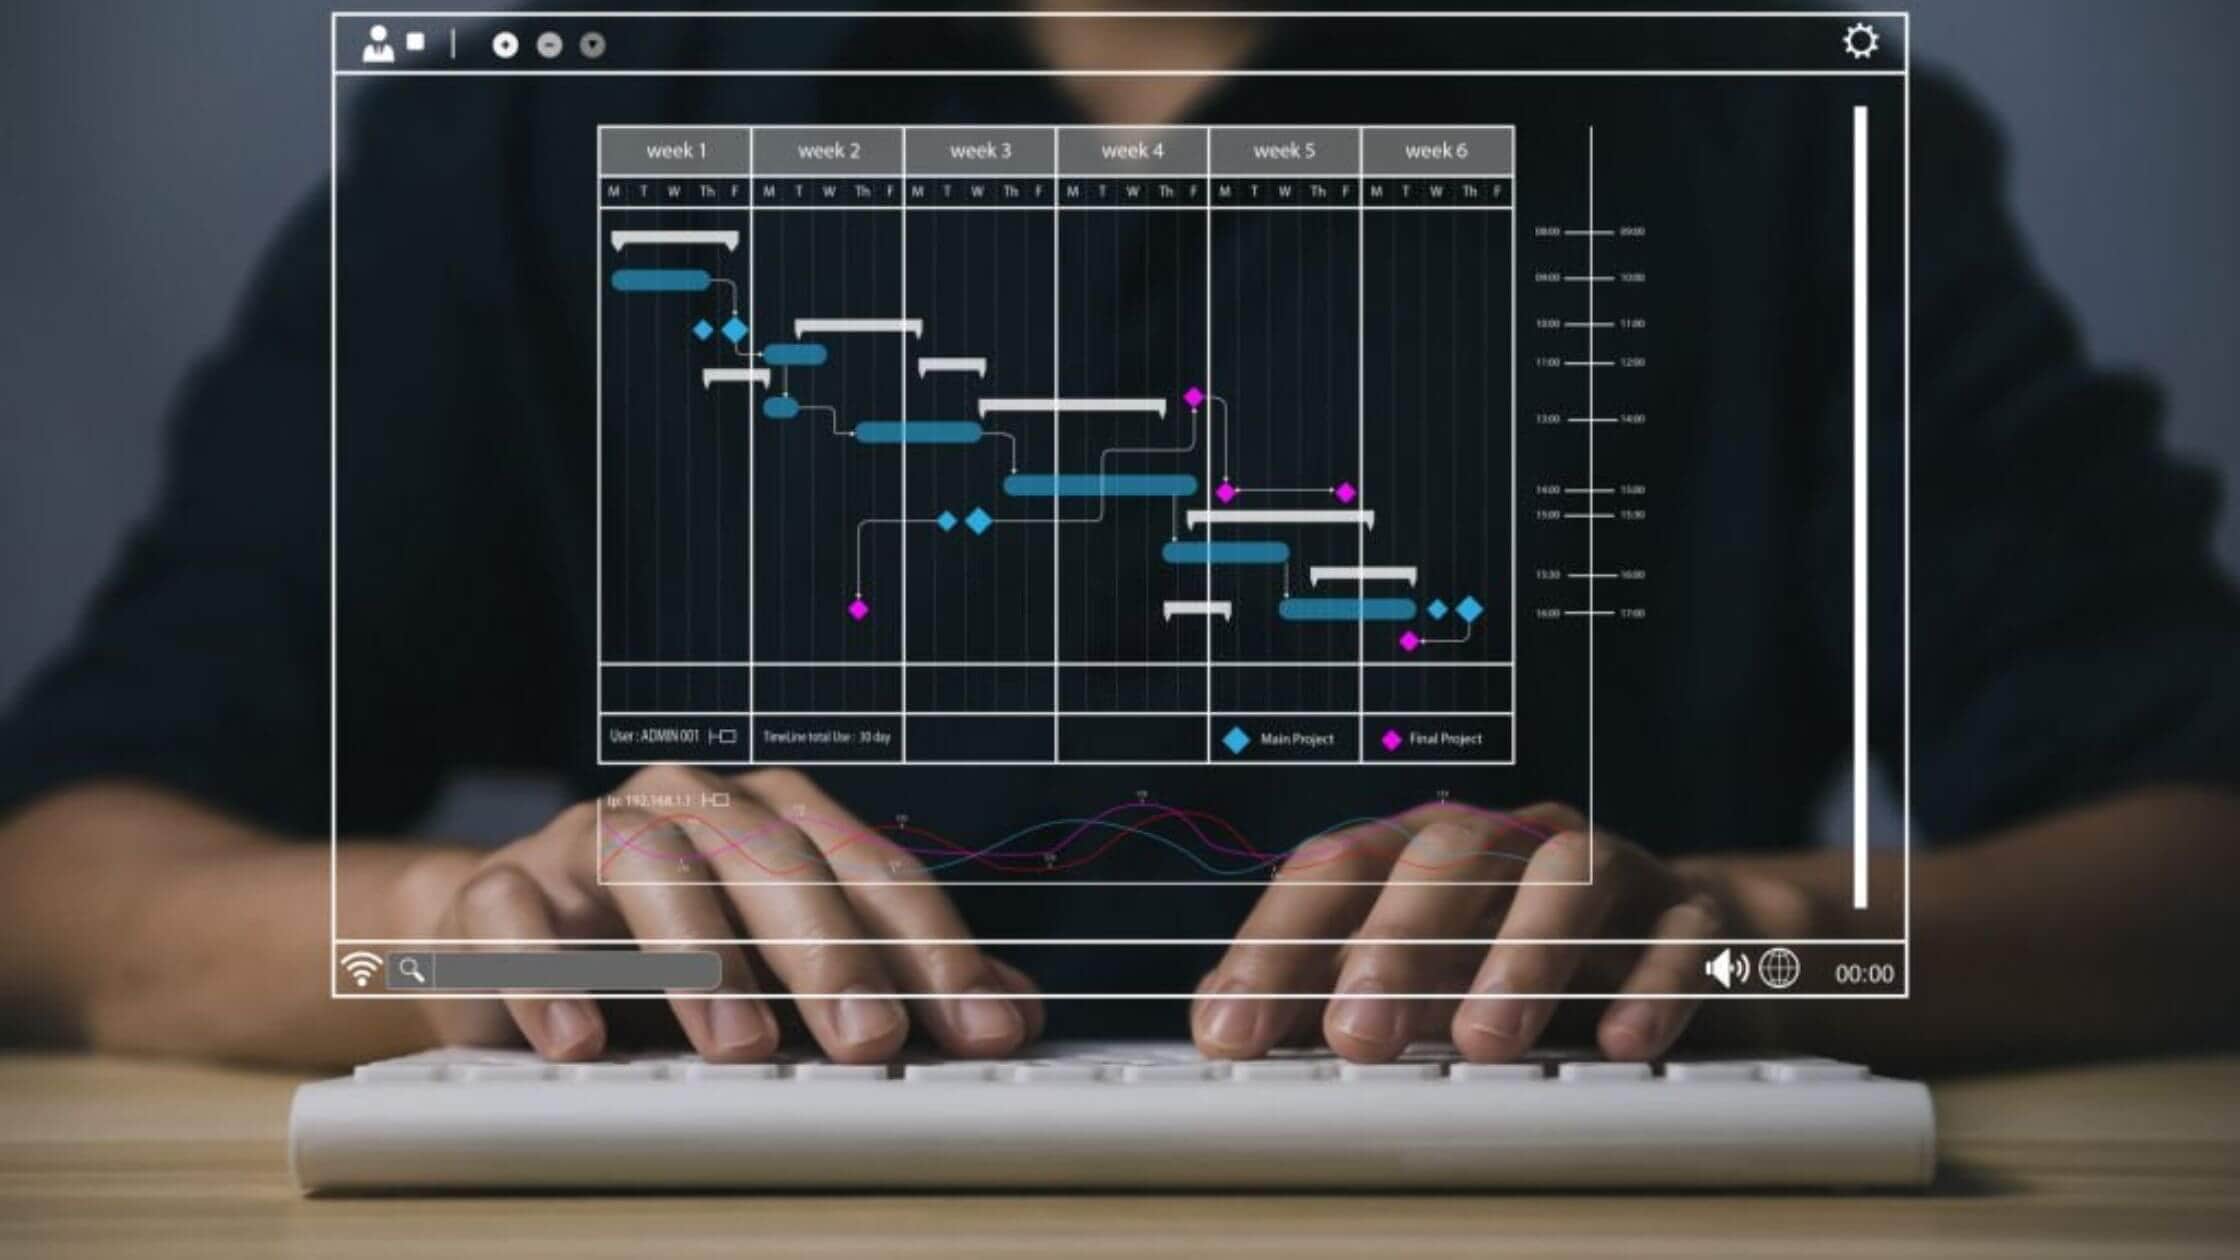
A burn chart is a visual project management tool that tracks the progress of work completed versus work remaining over time. Teams often use it in agile and Scrum environments to monitor performance and predict if they will meet project deadlines. The chart displays progress using lines or bars and typically covers a sprint, release, or project timeline. Its main goal is to help stakeholders assess the amount of work that the team has completed and the amount that remains, enabling better decision-making and planning.
Burn charts come in two common types: burndown charts and burnup charts. A burndown chart shows the amount of work remaining over time, while a burnup chart shows work completed. Both types can reveal trends, such as whether the team is ahead or behind schedule. These charts provide a quick, at-a-glance summary of team productivity and are widely used in daily stand-ups, sprint reviews, and retrospectives.
Key Points
- A burn chart visually tracks completed and remaining work throughout a project timeline.
- It is commonly used in agile and Scrum methodologies to support transparent progress reporting.
- The chart helps identify potential delays early by comparing actual progress to planned targets.
- Two main types exist: burndown charts (focus on work remaining) and burnup charts (focus on work completed).
- It supports team accountability, goal setting, and project forecasting.
Related Terms
- The burndown chart displays the remaining amount of work versus time.
- A burnup chart illustrates the amount of work completed, enabling teams to measure progress toward their goal.
- The product backlog provides the source data that feeds into the burn chart for sprint or release planning.
- A velocity chart helps calculate how much work a team typically completes in a sprint, which informs the burn chart’s baseline.
- The Scrum board offers a task-level view of project status, while the burn chart gives a high-level summary.
- The sprint retrospective may include reviewing the burn chart to reflect on team performance and identify areas for improvement.
- The sprint planning meeting utilizes past burn charts to estimate the amount of work that the project team can complete in the next sprint.
- The release plan incorporates burn chart data to determine whether the project will finish on time.
Burn Chart: Example
A development team working on a mobile app uses a burndown chart to track their two-week sprint. On the first day, the chart shows 100 hours of work remaining. As team members complete tasks, the chart updates daily. Midway through the sprint, the chart reveals they are behind schedule. The team adjusts priorities to stay on track, completing the sprint with only 5 hours remaining.
Burn Chart: Best Practices
- Update the chart daily to reflect accurate progress and changes.
- Select the appropriate chart type (burndown or burnup) based on your project’s needs.
- Keep the chart visible to all team members to promote transparency and accountability.
- Use the chart during stand-ups and sprint reviews to guide discussion.
- Regularly compare the chart against team velocity to spot issues early.
Additional Resources

Preparing for a PMI certification?
- Exam Prep Courses: PMP®, CAPM®, and PMI-ACP®
- Exam Simulators: PMP®, CAPM®, PMI-ACP®, PMI-PBA®, PMI-RMP®, PMI-SP®, PgMP®, and PfMP®
- Professional Development Units (PDUs): 15, 30, and 60 PDU Bundles